Table of Contents
Patient Flow and Staff Scheduling for Medical-Surgical Unit
Summary
The goal of this project is to automate and improve the process of predicting patient flow and staff scheduling in hospitals, which is currently highly variable and uncertain. We will achieve this by developing a patient census simulation that can be used to schedule nurses.
- Students: Sara Cronin, Evelyn Yeh
- Mentor(s): Dr. Sauleh Siddiqui
Background, Specific Aims, and Significance
There is increasing pressure on hospitals to improve their resource management, including staff scheduling, and reduce budgetary waste. Predicting patient flow is vital for staff scheduling and is linked heavily to patient safety, satisfaction, and quality of care. If the floor is understaffed, nurses will be overwhelmed with a high patient census, leading to worse patient outcomes. If the floor is overstaffed, there will be budgetary waste with idle nurses, leading to higher healthcare costs for patients. Currently, clinicians determine staff schedules by manually predicting patient census every morning, which is inefficient and subjective. This process should be automated and improved in accuracy by using historical data.
Our goals for the project are as follows:
- Understand and model patient flow in a unit
- We want to create a model that can accurately predict patient census.
- This model should be used to implement nurse scheduling.
- Evaluate staffing efforts
- Analyses done with the simulation can give advanced warning of the need for extra staff.
- The effects of increasing or decreasing staff levels can be examined.
If our project is successful, we will be able to provide information for patient census trends and feedback for staff scheduling to a hospital unit. Ultimately, this will help improve staff scheduling to be more effective and to reduce budgetary cost.
Deliverables
- Minimum: By 4/9
- Medical Surgical Unit Patient Flow Simulation
- Expected: By 4/27
- Patient Census Model
- Staff Matching Model
- Maximum: By 5/11
- Nurse Level Intervention Analyses Program
Technical Approach
All of the software will be written in Python. The data processing will be done using the pandas library in Python. The simulation will be created using SimPy, a discrete event simulation package in Python. We will keep track of software design and documentation using a shared Google Doc.
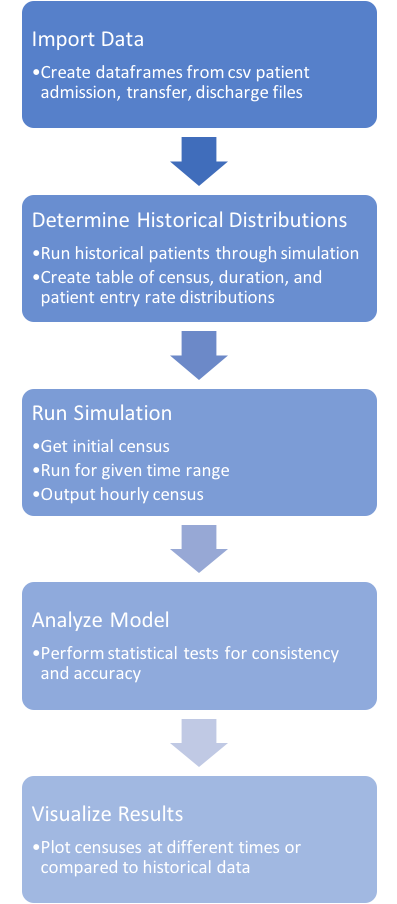
Data was primarily preprocessed depending on the season, day of the week, and time range that the patient movement is taking place. This temporal organization, which is used in simulating the patient census and throughout the project, was determined after consulting a nurse manager about the unit and examining trends evident in the data provided. A lookup table of historical distributions for each temporal parameter set was obtained. This included a census, length of stay, and patient entry rate information. The simulation that we created moves patients through the unit based on these historical distributions, outputting an hourly patient census.
Results
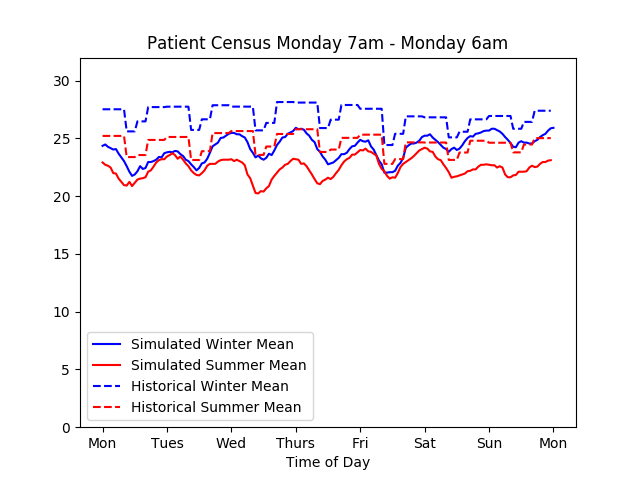
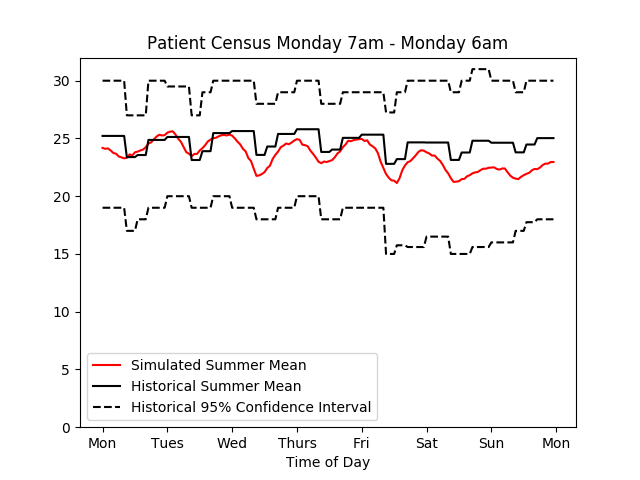
Various plots were created to visualize the simulated census and provide an indication of the simulation’s performance:
On the left the simulated and historical mean census values over a two week period are shown; 25 simulation iterations were used. On the right the simulated mean for a one week period is shown; the historical mean and 95% confidence interval are plotted as well; 50 simulation iterations were used.
As seen in the figures above, both seasonal and hourly temporal trends seen in historical data are shown in the simulation results. Simulation mean census results that included 50 iterations or more fell within the 95% confidence interval of the corresponding historical mean. The largest discrepancy was seen in the first few days of the simulation. This can be attributed to difficulties accurately assigning lengths of stay to patients added to the simulation at the start time.
Dependencies
- Obtain data from HCGH: completed. We have been working with deidentified patient data.
- Set up meeting with mentor: completed. We have a weekly meeting with Dr. Siddiqui on Friday mornings at 11:30 AM.
- Choose software: completed. We are coding in Python and using various packages such as SciPy, NumPy, and pandas to segment the patient data. We are using SimPy to create the patient census simulation and implement nurse matching.
- Determine nurse scheduling constraints: completed. We set up a meeting with a nurse manager at HCGH and obtained their insight on patient attributes, how they will affect the simulation, and how to best implement nurse matching.
Milestones and Status
- Obtain deidentified patient data and perform preprocessing
- Planned Date: 3/12
- Status: Completed
- Design simulation process flow
- Planned Date: 3/15
- Status: Completed
- Perform preprocessing on data
- Planned Date: 3/15
- Status: Completed
- Segment patient information based on attributes
- Planned Date: 3/20
- Status: Completed
- Create prediction model based on attributes
- Planned Date: 4/1
- Status: Completed
- Create simulation program
- Planned Date: 4/9
- Status: Completed
- Determine patient flow constraints
- Planned Date: 4/17
- Status: Completed
- Finish patient length of stay predictor
- Planned Date: 4/17
- Status: Completed
- Finalize census model
- Planned Date: 4/20
- Status: Completed
- Implement nurse matching to patient census
- Planned Date: 4/20
- Status: Completed
Create program to analyze effects of schedules- Planned Date: 5/4
- Status: Maximum Deliverable - not completed
- Validate results
- Planned Date: 5/11
- Status: Completed
Reports and presentations
- Project Plan
- Project Background Reading
- See Bibliography below.
- Project Checkpoint
- Paper Seminar Presentations
- Project Final Presentation
- Project Final Report
- Code Documentation
Project Bibliography
- Sauleh Siddiqui , Elizabeth Morse & Scott Levin (2017): Evaluating nurse staffing levels in perianesthesia care units using discrete event simulation, IISE Transactions on Healthcare Systems Engineering, DOI: 10.1080/24725579.2017.1346729
- Elina Kontio, Antti Airola, Tapio Pahikkala, Heljä Lundgren-Laine, Kristiina Junttila, Heikki Korvenranta, Tapio Salakoski, Sanna Salanterä, Predicting patient acuity from electronic patient records, Journal of Biomedical Informatics, Volume 51, 2014, Pages 35-40, ISSN 1532-0464, https://doi.org/10.1016/j.jbi.2014.04.001.
- Lee J, Maslove DM, Dubin JA (2015) Personalized Mortality Prediction Driven by Electronic Medical Data and a Patient Similarity Metric. PLoS ONE 10(5): e0127428. doi:10.1371/journal. Pone.0127428
- Rajeswari M, Amudhavel J, Pothula S, Dhavachelvan P. Directed Bee Colony Optimization Algorithm to Solve the Nurse Rostering Problem. Computational Intelligence and Neuroscience. 2017;2017:6563498. doi:10.1155/2017/6563498.
- Sir, M. Y., Dundar, B., Barker Steege, L. M., & Pasupathy, K. S. (2015). Nurse–patient assignment models considering patient acuity metrics and nurses’ perceived workload doi:https://doi.org/10.1016/j.jbi.2015.04.005
- Friese CR, Grunawalt JC, Bhullar S, Bihlmeyer K, Chang R, Wood W. Pod Nursing on a Medical/Surgical Unit: Implementation and Outcomes Evaluation. The Journal of nursing administration. 2014;44(4):207-211. doi:10.1097/NNA.0000000000000051.
- Carter, Kimberly F. and Hilda D. Burnette. “Creating Patient-Nurse Synergy on a Medical-Surgical Unit.” MEDSURG Nursing, vol. 20, no. 5, Sep/Oct2011, pp. 249-254. EBSCOhost, search.ebscohost.com/login.aspx?direct=true&db=a9h&AN=66439539&site=ehost-live&scope=site.
- Barnes S, Hamrock E, Toerper M, Siddiqui S, Levin S. Real-time prediction of inpatient length of stay for discharge prioritization. Journal of the American Medical Informatics Association: JAMIA. 2016;23(e1):e2-e10.
- Reid PP, Compton WD, Grossman JH, et al., eds. Building a Better Delivery System: A New Engineering/Health Care Partnership. Washington, DC: National Academies Press; 2006.
- Levin S, Dittus R, Aronsky D, et al. Evaluating the effects of increasing surgical volume on emergency department patient access. BMJ Qual Saf. 2011;20:146–152.
- Resar R, Nolan K, Kaczynski D, et al. Using real-time demand capacity management to improve hospital-wide patient flow. Jt Comm J Qual Patient Saf. 2011;37(5):217–227.
- Cure, L., Zayas-Castro, J., and Fabri, P. (2014) Challenges and opportunities in the analysis of risk in healthcare. IIE Transactions on Healthcare Systems Engineering, 4(2), 88–104.
Other Resources and Project Files
Zip file of project code: cisgroup12code.zip


