Contact Us
CiiS Lab
Johns Hopkins University
112 Hackerman Hall
3400 N. Charles Street
Baltimore, MD 21218
Directions
Lab Director
Russell Taylor
127 Hackerman Hall
rht@jhu.edu
The main goal of this project is to improve and automate the statistical atlas building pipeline developed by Dr. Gouthami Chintalapani at the Johns Hopkins University. We will then build a statistical atlas of the knee using CT images and use this statistical atlas for post-operative evaluations of anterior cruciate ligament (ACL) surgeries.
Currently, statistical atlas building methods depend largely on manual segmentation. Manual segmentation requires a lot of time and anatomical knowledge. By minimizing the human factor through the implementation of a semi- or fully-automated segmentation algorithm, the segmentation process will be more standardized, less prone to human error and the required time will be significantly shortened. Automating the current statistical atlas building pipeline will make the atlas building process more accessible to those with little or no programming experience.
Statistical atlases have a wide range of applications, including monitoring disease progression, accounting for anatomical variation in large populations and surgical planning. An automated atlas building pipeline will facilitate and increase the use of statistical atlases in surgical planning and post-operative evaluations. In this project, the specific application of the knee atlas will be to estimate the bone tunnel locations after ACL surgeries.
Our specific aims are:
Before working on automating the atlas-building pipeline and the segmentation/registration process, it is necessary to understand each component of the current implementation and how they interact with each other. The first step will be to gather all the programs and scripts required for the pipeline, and to run the whole process using sample data. Having a statistical atlas of the knee constitutes the first milestone of the project.
The second step will be to replace Analyze. ITK-SNAP, which is free software, can be substituted for Analyze to perform the preprocessing and the segmentation of the training images. Analyze is also used for other pre-processing tasks for the training images in the current pipeline, and MATLAB scripts can be used instead for those purposes.
The third step is automating the segmentation of the knee so that it requires minimal user interaction, if not none. Obtaining a semi-automated segmentation method constitutes the second milestone of the project. We will evaluate the performance of the semi-automated segmentation method against that of the manual method by comparing the segmentation accuracies and the amount of time it takes per dataset to perform segmentation.
The fourth step is to write a shell script that will automatically guide the user through the various steps of statistical atlas building. A fully automated pipeline is the third milestone.
The fifth step is to develop a model-based 3D-3D registration algorithm that can be used as an alternative to Mjolnir, the registration algorithm currently used in the pipeline. Depending on the quality of the statistical atlases produced by the pipeline leading up to this step, this algorithm might not be used in the bootstrapping portion of the atlas building.
FANTASMscript.sh and MJOLNIRscript.sh, the shell scripts used to perform the registration step in the atlas-building pipeline, are rewritten to accept command line arguments. Access to the Stomach server through X11 has been established. The shell scripts have been integrated into a MATLAB script that will guide the user through each component of the registration and allow for visualization of the results. * We obtained a pelvis atlas using the existing data and the original pipeline. Through this process, we learned how each component of the atlas-building pipeline functions and identified the parts of code that need to be changed.
* All MATLAB code has been moved to the Stomach server (Linux). In order to be able to visualize the results while using Linux, we use ssh with X11. Shell scripts in the pipeline have been changed to accept command line arguments. The registration part of the pipeline has been integrated with the use of a MATLAB script.
* We pre-processed the Hong Kong dataset (cadaver dry bone scans) and split the images into left femur, left tibia, right femur, and right tibia. We stored each of these images as raw unsigned char files. We used ITK-SNAP to segment the images and used the segmentation to generate a surface mesh. The surface mesh was used to obtain the tetrahedral mesh that will be used in the registration step of the atlas building pipeline.
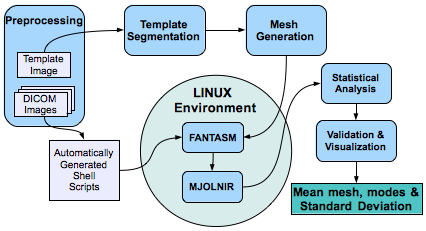
* The atlas building pipeline components have been integrated using MATLAB. The flow chart below demonstrates the tetrahedral mesh formation process.
* Image preprocessing for FANTASM and MJOLNIR has been performed. This includes ensuring that all patient images have the same number of voxels by cropping or padding the images, and making each voxel isotropic through trilinear interpolation.
* FANTASM and MJOLNIR results have been obtained with the Hong Kong data.
* PCA has been run on the results. A mean mesh and modes have been generated.
* A surface mesh has been created from the volumetric mean mesh from PCA results.
* A flowchart of our final pipeline is presented below.
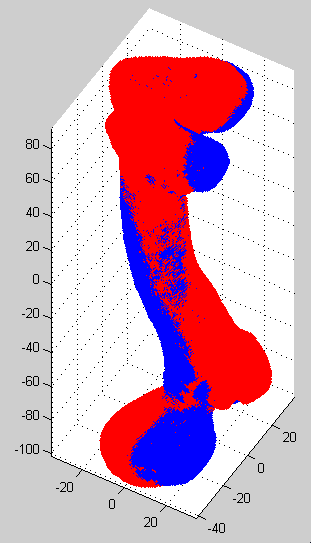
* Below is a superimposition of the mean right femur mesh (blue) and its first mode image (red). Note that the distal end of the femur is at the top. The first mode captures the variation in the length of the femur.
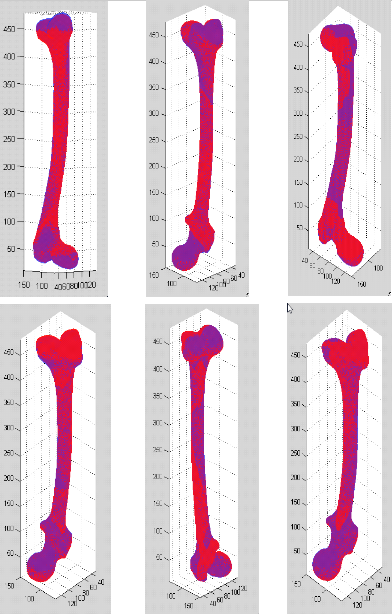
* Below are the superimpositions of the mean right femur mesh (blue) and its first 3 mode images (red). Each column corresponds to a different mode. The first row is obtained by adding 3σ*mode to the mean shape, and the second column is obtained by subtracting this value from the mean shape.
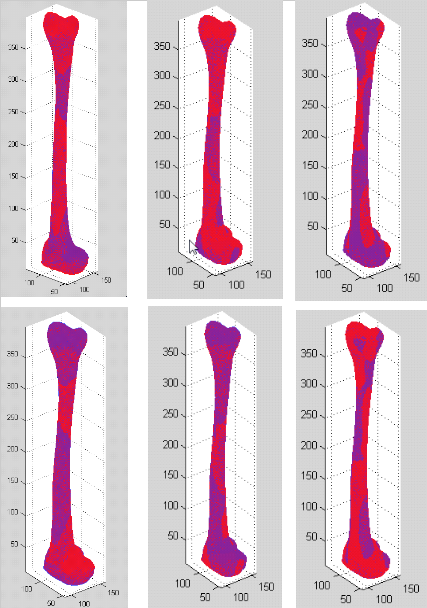
* Below are the superimpositions of the mean right tibia mesh (blue) and its first 3 mode images (red). See above for the explanation of the image.
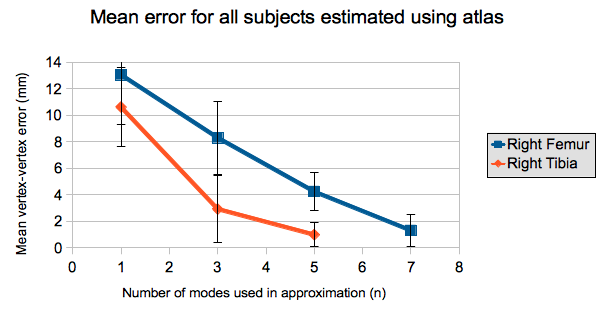
* The mean of the maximum vertex-vertex error values across all the subjects are presented below. Using more modes of variation when estimating shapes results in more accurate approximations.
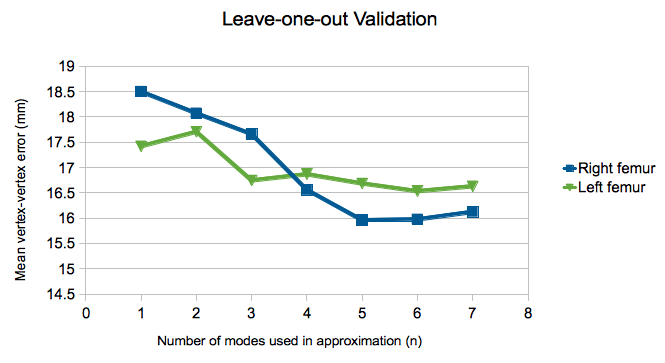
* The same evaluation was performed with leave-one-out validation, and the results are presented below.
* After obtaining atlases for both the left and right femur, we investigated whether it is necessary to create separate atlases for the left and right side by taking the mirror image of the right femur atlas and quantifying how similar it is to the left femur atlas.
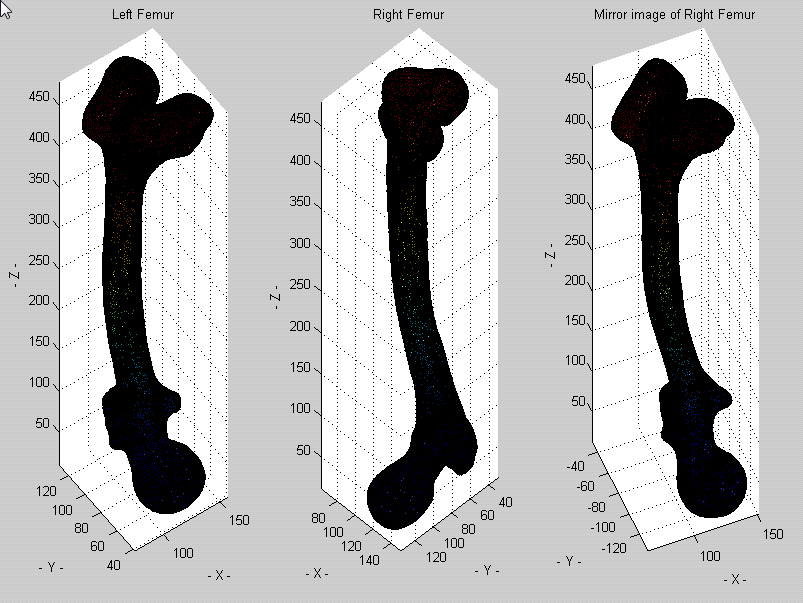
* Superimposition of the left femur mean shape (red) and the mirror image of right femur (blue) is presented below. The maximum vertex-vertex distance was 8 mm, indicating that separate atlases for the left and right femur might not be necessary due to the similarity between these two anatomical structures.
