Contact Us
CiiS Lab
Johns Hopkins University
112 Hackerman Hall
3400 N. Charles Street
Baltimore, MD 21218
Directions
Lab Director
Russell Taylor
127 Hackerman Hall
rht@jhu.edu
Last updated: Date and time
Enter a short narrative description here
You may want to include a picture or two here.
When patients have tumor in their body, doctors usually perform a surgery. They cut into body and excise the tumor. However, such a surgery will leave a permanent scar and great pain on patient. Nowadays, new technology HIFU (High Intensity Focused Ultrasound) system helps to relieve the pain. The machine is placed at the bottom of a patient and it send ultrasound focused on the tissue to increase the temperature. With the doctors’ operation, the machine ablates different small areas in the tissue and finally ablate all of them. MRI image is used to monitor the temperature in the body. The machine looks like below.
However, MRI machine is expensive and not portable. Our goal is to design a machine which is portable, low-cost so that every hospital can afford that. Easy to use so that doctors put more attention on ablating the tissue instead of operating the machine. Also, the image should be high quality and accurate. Thus, we plan to use the signals received from HIFU to generate temperature image with deep learning network and determine whether the cell is alive or not. Experiments are needed to collect data from the system.
performance
Here is how our experimental setup looks like. We have a HIFU at the bottom which conduct two different phases. Specifically, the first one is to send high intensity ultrasound to ablate the tissue. The second one is to send signals which is received by US probe in order to monitor the temperature in the phantom. The top one is US probe which has 128 elements which means we can receive signals from 128 places to get more information.
The signal received is relevant to temperature based on the fact that speed of sound and attenuation ratio of signal will change as temperature changes. The curve looks like below.
We plan to design different networks to generate the temperature image and choose best of them as final version. Below are four different structures we plan to use and validate. With the help of CNN we can extract features in the signals like attenuation rate and change of Time of Flight. By using LSTM, we take information in previous stages as reference to help predict current temperature image. Since we have both axial image and coronal image as ground truth, we use both of them as targets to improve performance. Since the distance of elements between probes is very small, the method of splitting data based on probe elements causes correlation between training set and test set. Thus, we proposed a random pick strategy which randomly pick 128 HIFU elements from 256 ones each time to be one data sets. We randomly pick 10 times to make training set, 2 for validation set and 2 for test set. Also, relative position between HIFU and probe element is included to help it perform better. Here is the network design. It passes through COnvLSTM cell to learn both temporal and spacial information. Then, it is concatenated with position vectors to provide more information. After that it passes through FLC layers and be reshaped to make image reconstruction.Finally, the temperature images are returned.
Here are the axial images. There are six phases in total. The temperature is from 20 to 45 celeis degrees.
Here are coronal images
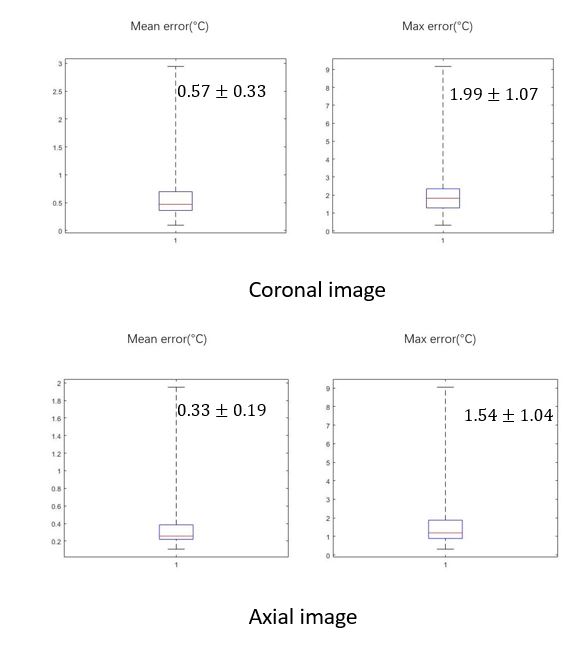
The evaluation box plot shows that mean error is small and max error is acceptable. The error of coronal images are smaller than axial images because coronal images are more regular and less pixels to predict.

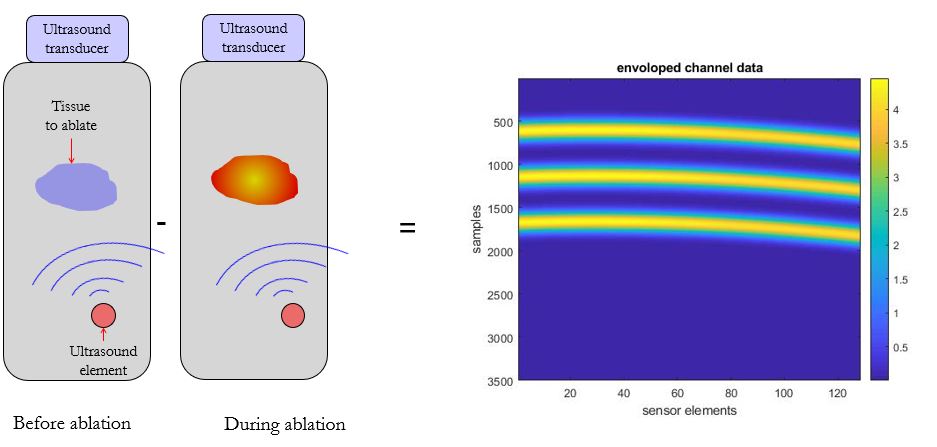
Next step is to use pattern injection method to predict images. By injecting pattern and deduct channel data with pattern and without it, we can get pure pattern images where no material related information is remained. Here is how it is deducted.

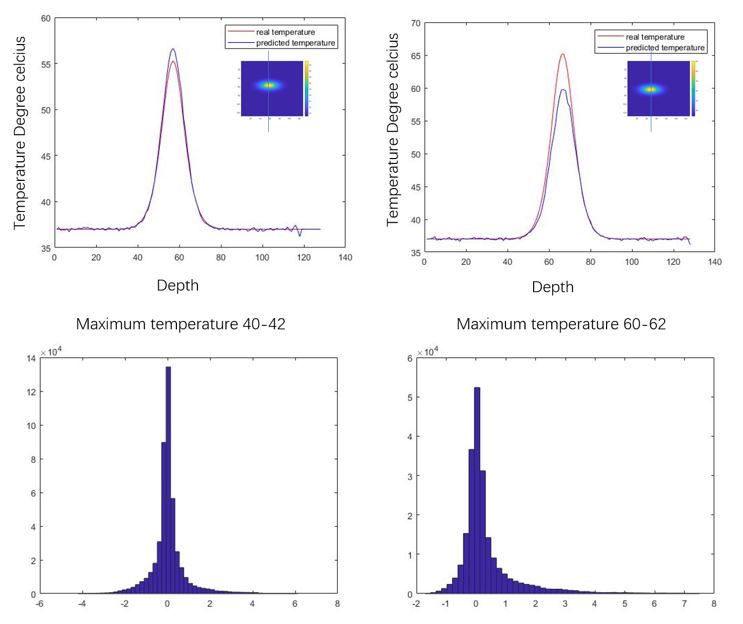
Emran helps me to design the network and I train the network to validate this method. The result shows the good performance in low temperature but bad ones on high temperature. It makes sense because in low temperature the speed of sound changes with temperature linearly and in high temperature it changes with speed of sound nonlinearly.

* here list references and reading material
Here give list of other project files (e.g., source code) associated with the project. If these are online give a link to an appropriate external repository or to uploaded media files under this name space (2019-06).