Contact Us
CiiS Lab
Johns Hopkins University
112 Hackerman Hall
3400 N. Charles Street
Baltimore, MD 21218
Directions
Lab Director
Russell Taylor
127 Hackerman Hall
rht@jhu.edu
Last updated: 05/06/2019
The goal of this project is to develop a User Interface that will allow researchers and clinicians the ability to select a patient cohort based upon any number of the variables in available patient information and view historic patient outcomes

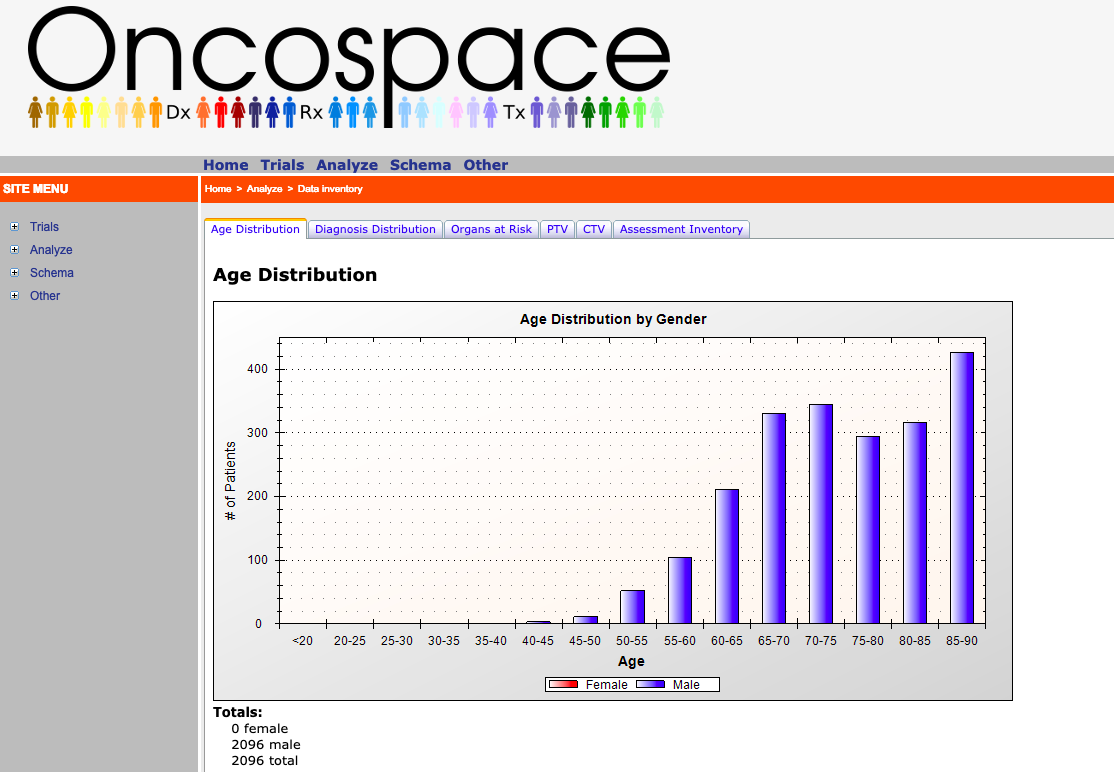
Background: There exists a SQL database which contains large amounts of data for different types of cancers and a website connecting with this database (Oncospace). For example, there is data for 1,550 head and neck radiation therapy patients with up to 6 years follow up and data for 2,096 prostate cancer patients. A website written in C# is connected with this database which has visualizations for different types of data. Some of these visualizations include distribution of clinical assessments and patient demographics. Each patient data point holds a variety of information, which can be categorized into static, longitudinal, or derived variables. Static variables are information about the patient that does not change throughout treatment. Examples of static variables are date of birth, race, gender, and diagnosis. Longitudinal variables are information that should change throughout the course of treatment and recovery. Typically these variables change as a function of time. An example of a longitudinal variable is duration and onset of symptoms. Lastly, we have the derived variables, which are information that require a mathematical computation to be applied to extract useful data out of. An example of such variable is the dose volume histogram, where each patient has a set of points making up a curve that must be looked at in its entirety.
Motivation: This data can be used for a significant amount of applications in regards to research and clinical care. There is a desire for doctors and researchers in applying this data for quality reporting, decision support, and studies. Specifically, quality reporting includes analyzing disparities of care, practicing quality reporting, and safety. Decision support includes toxicity prediction, data-driven quality control, and treatment adaptation. Lastly, research applications for this data include performing clinical trials and answering biological questions. Gaining all the benefits from the data available requires an easy to use system that can relay the information desired in a comprehensive format.
Problem: Currently, there is no quick and intuitive way to select patient cohorts from this database other than through a free text SQL Query. This requires knowledge of the exact variable names and some familiarity with the language. There are also no visuals of the outcomes of these patients selected by these many variables. Researchers hoping to compare groups or select a group to further study are prevented from fully utilizing the data available.
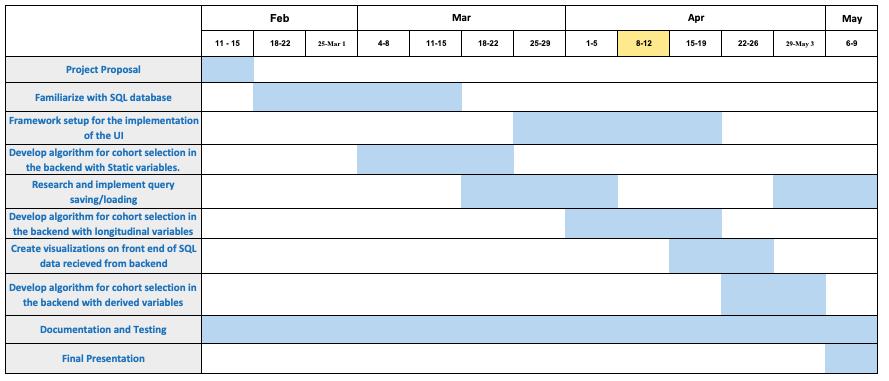
Timeline:

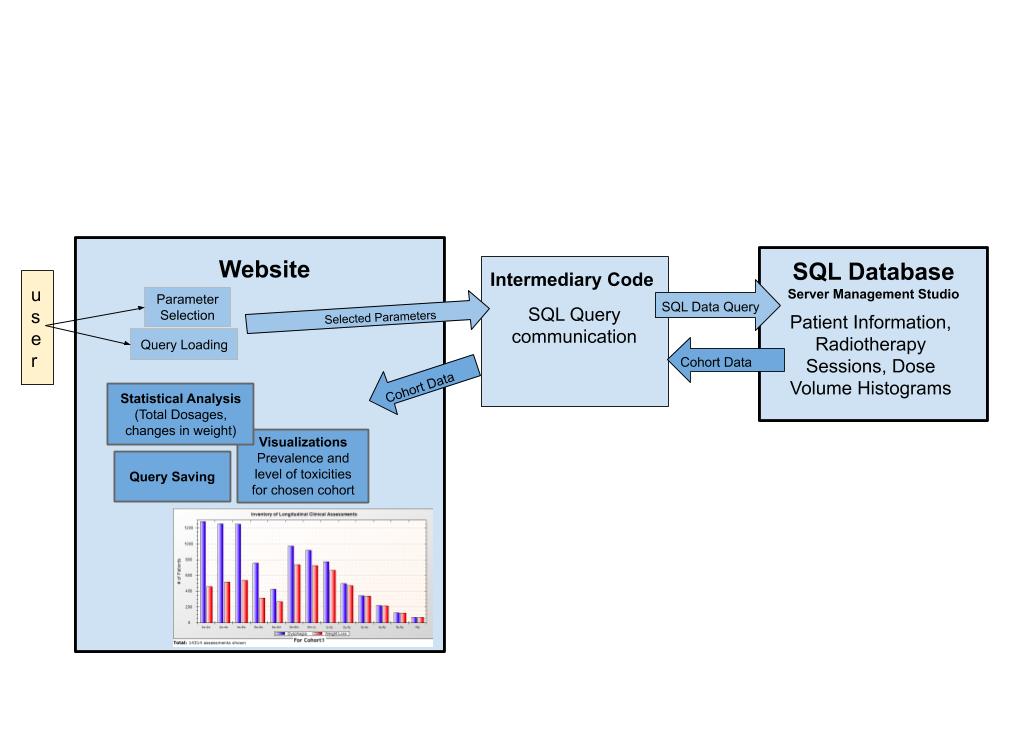
Block Diagram:

As seen in the block diagram linked above, the project involves the use of SQL and C#. Our approach is to create the code that will be able to manage the many variables and provide interfaces for those variables as cohort selection. The code that presents the options visually will be in C#. The data will be handled with SQL queries which involves an understanding of the variable types and a method to connect the web display with the data being accessed. The user should be able to traverse the database in an intuitive manner following the database’s schema. The interface should be able to join and link tables together for the cohort in regards to user’s desired parameters. A tool will be created that connects these two aspects of the project, most likely a JavaScript embedding to help with the connection.
Inputs: The user should be able to select through scroll down options of all the possible variables for cohort selection from the data. For each parameter the user should be able to add specifications. The user should also be able to input these variable selections and specifications into a terminal on the webpage similar to that of the current SQL terminal. The main method of inputting parameters should be more intuitive and allow for quick reloading of previously selected parameters.
Outputs: Firstly, a clear table display of all the patients within the cohort selected from the inputs. Secondly, appropriate visualizations and a statistical outputs that can be used on the cohorts selected. Visualizations will include a bar chart of selected toxicities with options to alter to normalized y axis (percentage of cohort), or an option to compare cohorts in line plot by prevalence of a chosen toxicity. Also, the user should be able to export the selected variables into a text file that can be used to reload a specific query quickly.
Benedict, S. “WE-H-BRB-01: Overview of the ASTRO-NIH-AAPM 2015 Workshop On Exploring Opportunities for Radiation Oncology in the Era of Big Data.” Medical Physics, vol. 43, no. 6Part42, 2016, pp. 3842–3842., doi:10.1118/1.4957989.
Benedict, Stanley H., et al. “Introduction to Big Data in Radiation Oncology: Exploring Opportunities for Research, Quality Assessment, and Clinical Care.” International Journal of Radiation Oncology *Biology* Physics, vol. 95, no. 3, 2016, pp. 871–872., doi:10.1016/j.ijrobp.2015.12.358.
Bibault, Jean-Emmanuel, et al. “Big Data and Machine Learning in Radiation Oncology: State of the Art and Future Prospects.” Cancer Letters, vol. 382, no. 1, 2016, pp. 110–117., doi:10.1016/j.canlet.2016.05.033.
Chen, Ronald C., et al. “How Will Big Data Impact Clinical Decision Making and Precision Medicine in Radiation Therapy?” International Journal of Radiation Oncology*Biology*Physics, vol. 95, no. 3, 2016, pp. 880–884., doi:10.1016/j.ijrobp.2015.10.052.
Mayo, Charles S., et al. “The Big Data Effort in Radiation Oncology: Data Mining or Data Farming?” Advances in Radiation Oncology, vol. 1, no. 4, 2016, pp. 260–271., doi:10.1016/j.adro.2016.10.001.
Mcnutt, Todd R., et al. “Needs and Challenges for Big Data in Radiation Oncology.” International Journal of Radiation Oncology*Biology*Physics, vol. 95, no. 3, 2016, pp. 909–915., doi:10.1016/j.ijrobp.2015.11.032.
Mcnutt, Todd R., et al. “Using Big Data Analytics to Advance Precision Radiation Oncology.” International Journal of Radiation Oncology*Biology*Physics, vol. 101, no. 2, 2018, pp. 285–291., doi:10.1016/j.ijrobp.2018.02.028.
Potters, Louis, et al. “A Systems Approach Using Big Data to Improve Safety and Quality in Radiation Oncology.” International Journal of Radiation Oncology*Biology*Physics, vol. 95, no. 3, 2016, pp. 885–889., doi:10.1016/j.ijrobp.2015.10.024.
Skripcak, Tomas, et al. “Creating a Data Exchange Strategy for Radiotherapy Research: Towards Federated Databases and Anonymised Public Datasets.” Radiotherapy and Oncology, vol. 113, no. 3, 2014, pp. 303–309., doi:10.1016/j.radonc.2014.10.001.
Here give list of other project files (e.g., source code) associated with the project. If these are online give a link to an appropriate external repository or to uploaded media files under this name space (2019-08).